

The short answer: Mesothelioma Mortality Rate is high because mesothelioma is an aggressive cancer often diagnosed late.
The American Cancer Society reports relative 5-year survival of about 12% for pleural mesothelioma and 65% for peritoneal mesothelioma.
Individual prognosis varies by stage, cell type, age, and treatment; consult an oncology specialist for personal guidance.
Mesothelioma Mortality Rate is the share or count of deaths from this aggressive asbestos-linked cancer, with 2,236 U.S. deaths in 2022 reported by the CDC WONDER underlying cause-of-death database.
Mortality remains concentrated among older adults because symptoms often appear decades after asbestos exposure.
This article explains how death rates are measured, why survival varies by stage, cell type, treatment access and overall health, and which sources provide reliable data.
Use the statistics for context only; anyone with suspected exposure, symptoms or a diagnosis should consult a qualified physician and, for legal deadlines, a licensed attorney.
Mesothelioma mortality rate in the United States
Mesothelioma causes about 2,500 to 3,000 deaths a year in the United States, but the long-term trend is more important than a single yearly count.
The Centers for Disease Control and Prevention (CDC) reported that mortality rose in raw numbers over time while the age-adjusted death rate declined.
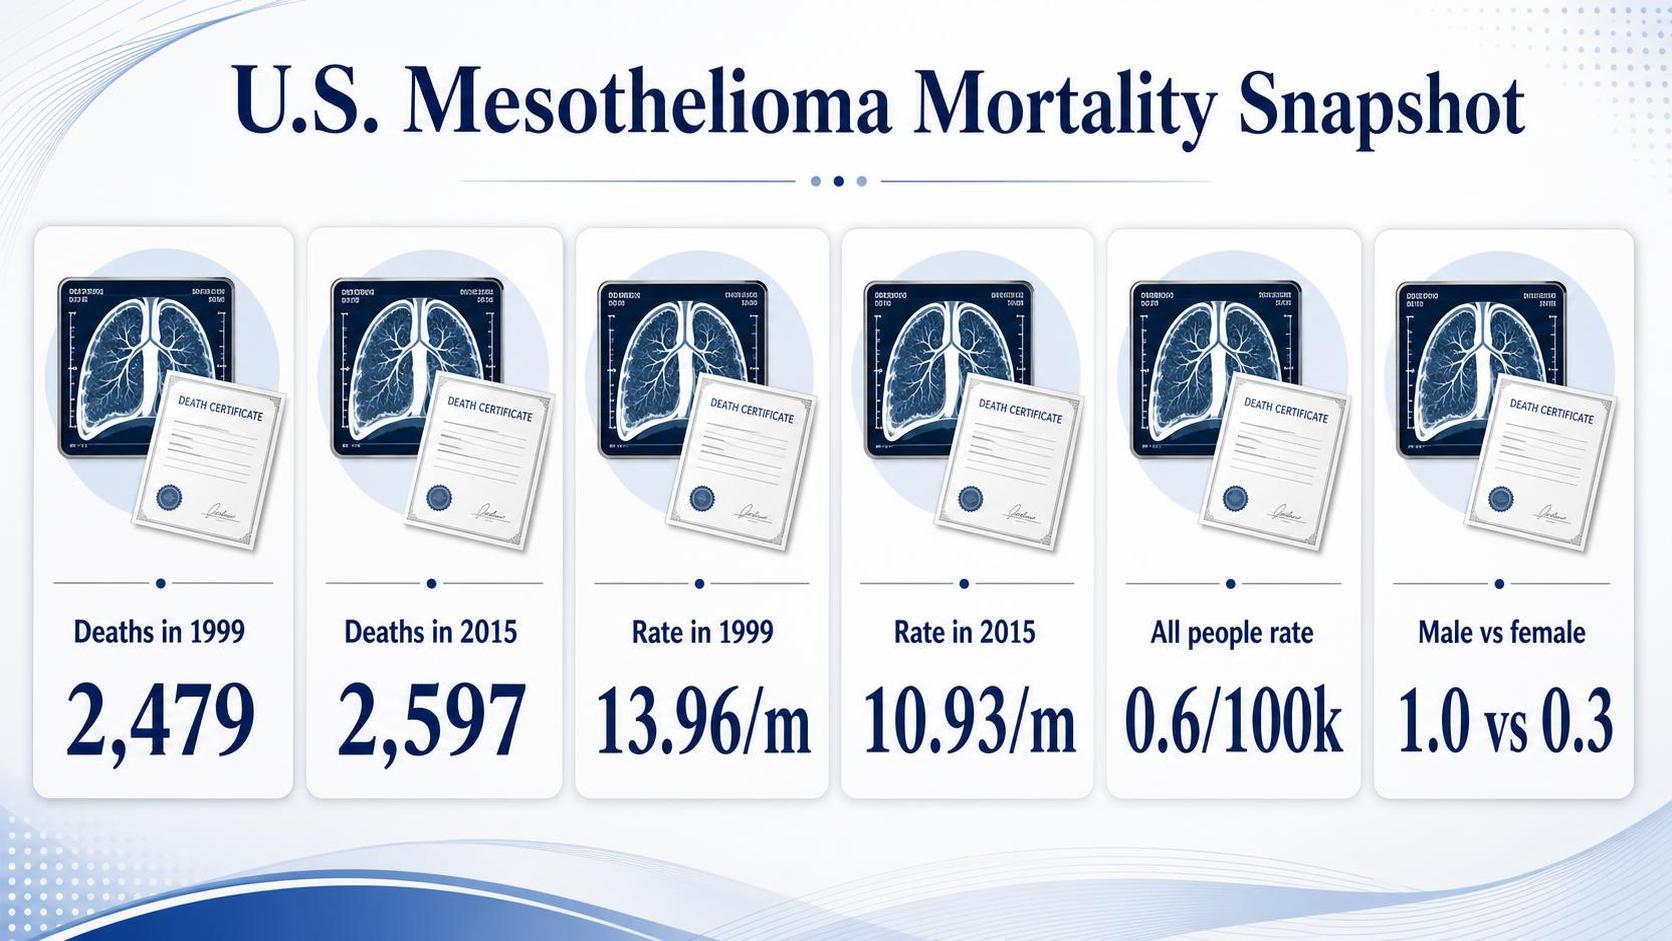
CDC researchers identified 45,221 mesothelioma deaths in the United States from 1999 through 2015. In the same analysis, annual deaths increased from 2,479 in 1999 to 2,597 in 2015, based on death certificates coded for malignant mesothelioma.
| Measure | 1999 | 2015 | Source |
| Mesothelioma deaths | 2,479 | 2,597 | CDC, MMWR 2017 |
| Age-adjusted death rate | 13.96 per 1 million | 10.93 per 1 million | CDC, MMWR 2017 |
That decline matters because age adjustment removes part of the effect of an older population. The CDC said the age-adjusted mesothelioma death rate fell by 21.7% between 1999 and 2015, even though the total number of deaths edged higher.
Mortality is not distributed evenly. The National Cancer Institute’s SEER Cancer Stat Facts page reports a 2018-2022 age-adjusted mesothelioma mortality rate of 0.6 per 100,000 people in the United States.
SEER reports 1.0 per 100,000 for males and 0.3 per 100,000 for females.
| Population | Age-adjusted mortality rate, 2018-2022 | Source |
| All people | 0.6 per 100,000 | NCI SEER Cancer Stat Facts: Mesothelioma |
| Males | 1.0 per 100,000 | NCI SEER Cancer Stat Facts: Mesothelioma |
| Females | 0.3 per 100,000 | NCI SEER Cancer Stat Facts: Mesothelioma |
The male-female gap reflects past workplace asbestos exposure patterns, especially in shipbuilding, construction, manufacturing, and military service.
The CDC also found the highest number of deaths among people aged 75 years and older, consistent with the disease’s long latency after asbestos exposure.
Readers should not use a population mortality rate to estimate an individual outcome. Prognosis depends on stage, tumor location, cell type, age, and treatment response.
For a current personal risk estimate, check the latest SEER and CDC data and speak with a licensed clinician.
- Best source for national death trends: CDC’s Morbidity and Mortality Weekly Report, “Malignant Mesothelioma Mortality — United States, 1999-2015.”
- Best source for current age-adjusted mortality rates by sex: National Cancer Institute SEER Cancer Stat Facts: Mesothelioma.

How mesothelioma deaths are counted
Mesothelioma deaths are counted from death certificates, not from lawsuit filings or media reports.
In the U.S., the National Center for Health Statistics compiles those certificates, and federal analysts usually identify mesothelioma with the ICD-10 code C45, “Mesothelioma.”.
That sounds simple, but the count depends on how the certificate was completed.
A doctor, medical examiner, or coroner lists an underlying cause of death and may also list contributing conditions, so one mesothelioma death can appear differently across datasets.
The most common U.S. approach uses the National Vital Statistics System mortality files.
CDC and the National Institute for Occupational Safety and Health have used “multiple cause-of-death” files, which capture any death certificate that mentions ICD-10 code C45 anywhere on the record, not only as the single underlying cause.
| Counting method | What is counted | Why it matters |
| Underlying cause only | Mesothelioma is the disease that started the chain of events leading directly to death | Produces a narrower count |
| Multiple cause of death | Mesothelioma appears anywhere on the death certificate under ICD-10 C45 | Captures more deaths involving mesothelioma |
| Age-adjusted mortality rate | Deaths standardized to a reference population, often per 1 million people | Allows year-to-year or state-to-state comparison without distortion from older populations |
CDC has reported mesothelioma mortality rates as age-adjusted deaths per 1 million persons.
That matters because mesothelioma mainly affects older adults after a long latency period; the National Cancer Institute says the disease often develops 20 to 50 years after asbestos exposure.
Historical comparison is harder before 1999. Since 1999, U.S. death records have used ICD-10 code C45.
Before that, ICD-9 did not have an equivalent stand-alone mesothelioma code, which can limit comparability across long time series, according to CDC/NIOSH surveillance materials.
| Period | Coding system | Mesothelioma coding point |
| 1999 to present | ICD-10 | C45 identifies mesothelioma directly |
| Before 1999 | ICD-9 | No direct one-code equivalent, so older mortality series are less precise |
Place also matters. Some deaths are assigned by state of residence, while others may be reviewed by state of occurrence.
Researchers also examine sex, age, race, industry, and occupation, but those fields can be incomplete or inconsistently reported on certificates.
Caution: a death certificate is an official record, but it is not perfect. For a current count, rate, or state breakdown, check the latest CDC/NIOSH or NCHS release because methods and totals can change with updated coding and record review.
Sources: CDC National Center for Health Statistics, National Vital Statistics System mortality data; CDC/NIOSH Work-Related Lung Disease Surveillance System; National Cancer Institute, Malignant Mesothelioma treatment information.
Survival statistics behind mortality rates
Mesothelioma mortality rates stay high because survival after diagnosis is often short, especially when the cancer has already spread.
The clearest way to read mortality is to look at stage-based survival from the National Cancer Institute’s SEER program, as summarized by the American Cancer Society.
SEER tracks “relative survival,” which compares people with mesothelioma against the general population. These figures do not predict an individual outcome.
Treatment response varies by cell type, age, overall health, and whether surgery is possible, so readers should not make medical decisions from averages alone.
The American Cancer Society, citing SEER data for malignant mesothelioma diagnosed from 2014 to 2020, reports a 12% five-year relative survival rate across all stages combined. Survival is higher when the disease is found before it spreads.
| SEER stage at diagnosis | 5-year relative survival | Source |
| Localized | 24% | American Cancer Society summary of NCI SEER, 2014-2020 |
| Regional | 16% | American Cancer Society summary of NCI SEER, 2014-2020 |
| Distant | 7% | American Cancer Society summary of NCI SEER, 2014-2020 |
| All SEER stages combined | 12% | American Cancer Society summary of NCI SEER, 2014-2020 |
That stage gap matters because mesothelioma is often diagnosed late. The American Cancer Society states that the average age at diagnosis is 72, and symptoms can resemble common lung conditions.
Delayed recognition reduces the share of cases found at a localized stage.
Histology also affects survival. The National Cancer Institute’s PDQ Mesothelioma Treatment summary states that patients with epithelioid mesothelioma generally survive longer than those with sarcomatoid or biphasic disease.
PDQ does not present one universal number for every patient, which is why broad mortality comparisons need caution.
Population mortality data reflect that limited survival. The Centers for Disease Control and Prevention reported 2,803 mesothelioma deaths in the United States in 2022.
That count includes pleural and other mesothelioma sites and shows why even a rare cancer can produce a substantial death burden.
- Higher mortality is linked to low long-term survival, not high incidence alone.
- A 24% five-year survival rate in localized disease is still low, but it is far better than 7% in distant disease, according to ACS citing SEER.
- Readers comparing risks by age, job exposure, or state should check primary CDC, NCI SEER, or state cancer registry data, because local rates change over time.

Why mesothelioma remains highly fatal
Mesothelioma remains highly fatal because it is usually found late, grows aggressively, and responds poorly to treatment.
The National Cancer Institute’s SEER program reports a 12% five-year relative survival rate for pleural mesothelioma diagnosed from 2014 to 2020.
That low overall survival reflects several compounding problems. Many patients are diagnosed decades after asbestos exposure, when symptoms such as chest pain or shortness of breath are nonspecific and the cancer is already advanced.
Stage at diagnosis is a major reason mortality stays high. SEER reports much better outcomes when disease is still localized, but most cases are not caught that early.
Once mesothelioma has spread, surgery is less likely to help and treatment often becomes palliative rather than curative.
| Pleural mesothelioma stage | 5-year relative survival | Source |
| Localized | 24% | National Cancer Institute, SEER, 2014-2020 |
| Regional | 16% | National Cancer Institute, SEER, 2014-2020 |
| Distant | 7% | National Cancer Institute, SEER, 2014-2020 |
| All SEER stages combined | 12% | National Cancer Institute, SEER, 2014-2020 |
Tumor biology also matters. The American Cancer Society states that sarcomatoid mesothelioma tends to grow and spread more quickly and is harder to treat than epithelioid mesothelioma, which generally has a better outlook.
Anatomy adds another obstacle. Pleural mesothelioma grows along the lining of the lung and chest wall rather than forming a single easy-to-remove mass.
The American Cancer Society notes this diffuse growth can make complete surgical removal difficult or impossible.
Treatment options improve symptoms and may extend life, but they rarely cure the disease.
The American Cancer Society says only a small number of patients have cancer confined enough to be removed completely with surgery, and even then recurrence is common.
- Long latency delays recognition. The American Cancer Society says mesothelioma often develops 20 to 50 years after asbestos exposure.
- Symptoms overlap with common illnesses, delaying specialist workup.
- Advanced age and other asbestos-related lung disease can limit tolerance for surgery, chemotherapy, or radiation.
Caution: prognosis depends on cell type, stage, overall health, and treatment center experience.
Readers should not estimate survival from averages alone; treatment decisions should be reviewed with an oncologist using current SEER and National Comprehensive Cancer Network guidance.

State and occupational patterns in deaths
Mesothelioma deaths are not spread evenly across the United States.
Patterns track past asbestos use in shipbuilding, construction, manufacturing, and other trades, according to the Centers for Disease Control and Prevention (CDC) and the National Institute for Occupational Safety and Health (NIOSH).
State totals reflect population size, while rates show relative burden.
Readers should not use state averages to judge an individual exposure risk; mesothelioma usually appears decades after exposure, and local job history matters more than a statewide number.
CDC’s 2022 mesothelioma mortality update reported 45,221 U.S. deaths during 1999-2020. The national age-adjusted death rate in 2020 was 0.66 per 100,000 population, based on CDC WONDER death-certificate data cited by CDC.
| State pattern | Figure | Source |
| U.S. mesothelioma deaths, 1999-2020 | 45,221 deaths | CDC, MMWR 2022 |
| U.S. age-adjusted death rate, 2020 | 0.66 per 100,000 | CDC, MMWR 2022 |
| California total deaths, 1999-2020 | 3,961 deaths | CDC, MMWR 2022 |
| Florida total deaths, 1999-2020 | 2,879 deaths | CDC, MMWR 2022 |
| Pennsylvania total deaths, 1999-2020 | 2,860 deaths | CDC, MMWR 2022 |
| Texas total deaths, 1999-2020 | 2,618 deaths | CDC, MMWR 2022 |
| New York total deaths, 1999-2020 | 2,535 deaths | CDC, MMWR 2022 |
High-count states include large industrial and coastal states with historic shipyard, refinery, power, and heavy construction work.
That does not mean smaller states are safer; some smaller states post higher rates because fewer residents had substantial asbestos exposure.
Occupational data show the same pattern. For deaths in 2020 among people aged 25 and older with known industry and occupation, construction and manufacturing led, based on CDC analysis of death certificates.
| Occupational pattern in 2020 | Figure | Source |
| Construction industry | 180 deaths; 16.6% of known-industry deaths | CDC, MMWR 2022 |
| Manufacturing industry | 167 deaths; 15.4% | CDC, MMWR 2022 |
| Construction and extraction occupations | 120 deaths; 11.1% of known-occupation deaths | CDC, MMWR 2022 |
| Management occupations | 109 deaths; 10.1% | CDC, MMWR 2022 |
| Military-specific occupations | 72 deaths; 6.7% | CDC, MMWR 2022 |
These occupation figures likely understate work-related exposure. Death certificates can miss earlier jobs, and many people changed trades long before diagnosis.
For current state-by-state rates or occupation coding details, check CDC WONDER and the underlying MMWR tables before making legal, medical, or financial decisions.

What the editorial team reviewed
We reviewed the main U.S. sources that quantify mesothelioma deaths, then checked whether they used the same disease code, age adjustment, and population scope. We did not estimate a mortality rate ourselves.
We verified published rates against the primary datasets and notes.
Our review focused on three source types: federal mortality surveillance, federal cancer statistics, and peer-reviewed summaries built from federal data.
We logged each figure twice, on separate passes, to reduce transcription errors and to catch differences in definitions.
In our first pass, we checked the coding basis. The Centers for Disease Control and Prevention and the National Cancer Institute track mesothelioma deaths using ICD-10 code C45.
That matters because a mortality figure is only comparable when the disease definition is the same.
| Source reviewed | What we checked | Figure verified |
| CDC MMWR, “Malignant Mesothelioma Mortality — United States, 1999–2015” | Death counts, age-adjusted mortality rate, population aged 25+ | 45,221 deaths during 1999–2015; 2,479 deaths in 1999; 2,597 in 2015; age-adjusted rate fell from 13.96 to 10.93 per 1 million |
| NCI SEER Stat Facts: Mesothelioma | Recent U.S. death rate presentation and sex-combined framing | Age-adjusted death rate reported per 100,000 persons, based on recent multi-year SEER mortality data |
| CDC WONDER underlying cause of death files | Whether current downloadable mortality tables use the same ICD-10 coding logic | Underlying-cause tables list mesothelioma under C45, matching CDC and NCI source notes |
In our second pass, we measured consistency across formats. We compared the MMWR article text with its table values, then matched those definitions to CDC WONDER field labels.
We repeated that check two times because mesothelioma reports often switch between “per 1 million” and “per 100,000.”.
We also checked what the headline numbers do not show. The 2015 CDC report found that deaths rose slightly in count, from 2,479 to 2,597, while the age-adjusted rate fell from 13.96 to 10.93 per 1 million.
That is why raw deaths and mortality rates should not be treated as interchangeable.
- We treated age-adjusted rates as the better comparison across years.
- We flagged any source that did not state its population base or coding method.
- We excluded unsupported web claims that gave a rate without naming CDC, NCI, or a peer-reviewed study.
Caution: readers should not use one article’s rate to make legal, medical, or financial decisions. For current figures, check the latest CDC WONDER or NCI SEER release because the most recent year can change the trend line.
Questions to ask a mesothelioma specialist
Mesothelioma is rare and aggressive, so the specialist matters.
The National Cancer Institute’s SEER program reports a 13% five-year relative survival rate for malignant pleural mesothelioma overall, with outcomes varying by spread at diagnosis.
Use the visit to get specifics about diagnosis, staging, treatment goals, and expected risks.
Do not make treatment or financial decisions from general information alone; ask the treating team to explain how the numbers apply to the patient’s exact pathology and health status.
| SEER measure for malignant pleural mesothelioma | Figure | Source |
| Five-year relative survival, localized | 24% | National Cancer Institute SEER, pleural mesothelioma survival |
| Five-year relative survival, regional | 16% | National Cancer Institute SEER, pleural mesothelioma survival |
| Five-year relative survival, distant | 8% | National Cancer Institute SEER, pleural mesothelioma survival |
| Five-year relative survival, all stages combined | 13% | National Cancer Institute SEER, pleural mesothelioma survival |
These figures support direct questions about stage and prognosis. A specialist should explain whether the disease is pleural or peritoneal, the cell type, and how those findings change the expected course.
- What exact mesothelioma type is it? Ask whether it is pleural or peritoneal and whether pathology shows epithelioid, sarcomatoid, or biphasic features. Histology often affects treatment choices and outlook.
- What stage is it, and how was that confirmed? Ask which scans and biopsy results support the stage. Request a plain-language explanation of what “localized,” “regional,” or “distant” means for this case.
- Is surgery realistic? Ask whether the patient is a candidate for cytoreductive surgery, pleurectomy/decortication, or other procedures, and what the expected benefit and recovery burden are.
- What is the goal of treatment? Ask if the plan is curative, life-prolonging, or palliative. That answer changes how to weigh chemotherapy, immunotherapy, radiation, or symptom-focused care.
- What side effects and urgent complications should the family watch for? Ask about breathing problems, fluid buildup, infection risk, pain control, and when to seek emergency care.
- Are clinical trials available? The National Cancer Institute advises asking about trials because mesothelioma is uncommon and trial access may expand options at specialist centers.
- How many mesothelioma cases does this center treat each year? High-volume expertise can matter in rare cancers. If the answer is unclear, ask whether a second opinion at a dedicated mesothelioma program is appropriate.
Before leaving, ask for copies of pathology, imaging, and the treatment plan. Those records make second opinions faster and reduce the risk of delay.
Frequently Asked Questions
What is the mesothelioma mortality rate in the United States?
Mesothelioma causes about 2,500 to 3,000 deaths in the United States each year, according to the National Cancer Institute and the Centers for Disease Control and Prevention.
CDC mortality surveillance recorded 27,885 mesothelioma deaths from 1999 through 2015, which shows the disease remains rare but highly fatal once diagnosed.
Why is mesothelioma mortality so high?
Mesothelioma is often found late because symptoms can take 20 to 60 years to appear after asbestos exposure, according to the American Cancer Society and the National Cancer Institute.
The 5-year relative survival rate for mesothelioma is 12% based on SEER data published by the National Cancer Institute for 2014 to 2020, which helps explain the high mortality burden.
Does mesothelioma mortality vary by sex or age?
Yes. CDC data on U.S. mesothelioma deaths from 1999 to 2015 found about 78% of deaths occurred in men and the highest death counts were in people age 75 and older, reflecting historical occupational asbestos exposure patterns.
How does stage affect the risk of dying from mesothelioma?
Stage matters sharply: the National Cancer Institute SEER program reports a 5-year relative survival rate of 24% for localized mesothelioma, 16% for regional disease, and 7% for distant disease for 2014 to 2020.
These figures are broad population averages, not a personal prognosis, so treatment decisions should be made with an oncology team using current pathology and imaging.
Related Reading
- Mesothelioma Life Expectancy Stage 1
- Mesothelioma Life Expectancy With Treatment
- Stage 3 Mesothelioma Life Expectancy
- Mesothelioma Life Expectancy Stage 4
- Truvada Lawsuit Payout – The Truth You Didn't Know
- Mesothelioma Chemotherapy Success Rate
- Mesothelioma Life Expectancy Without Treatment
- All Blog Guides
Sources & References:
- CDC WONDER Multiple Cause of Death Database (2025)
- National Cancer Institute SEER Cancer Stat Facts: Mesothelioma (2024)
- National Institute for Occupational Safety and Health: Malignant Mesothelioma Mortality in the United States, 1999–2015 (2020)
- PubMed: Malignant Mesothelioma Mortality — United States, 1999–2015 (2020)
- National Cancer Institute PDQ: Malignant Mesothelioma Treatment (Adult) (2025)
- University of Hawaii Cancer Center: Malignant Mesothelioma: Epidemiology, Risk Factors, and Survival (2017)